Demo (Kinase PPI Network)
Contents
Load the sample dataset (Kinase PPI Network)
This sample dataset loads two variables: NodeList, a table with 3 fields (Kinases):
- Name: Identifier for the node
- ZScore: A quantitative score
- NumTargets: Number of targets used in quantitative score calculation
EdgeList, a table with 2 fields (PPI interactions):
- Node1: Name of first endpoint u of an edge (u, v)
- Node2: Name of second endpoint v of an edge (u, v)
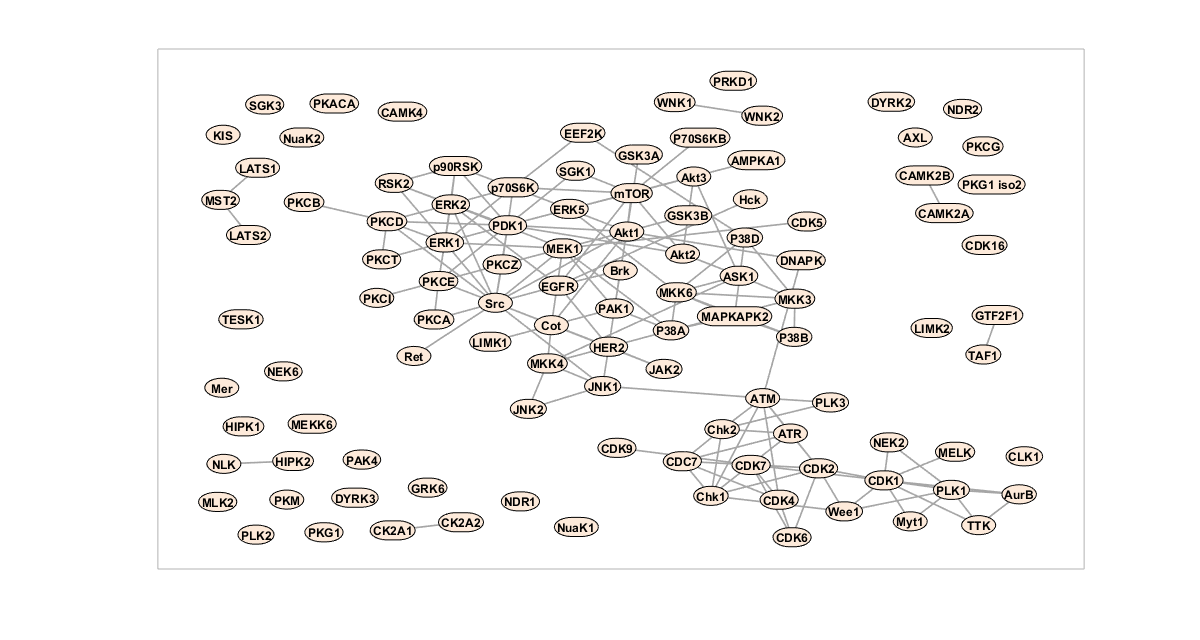
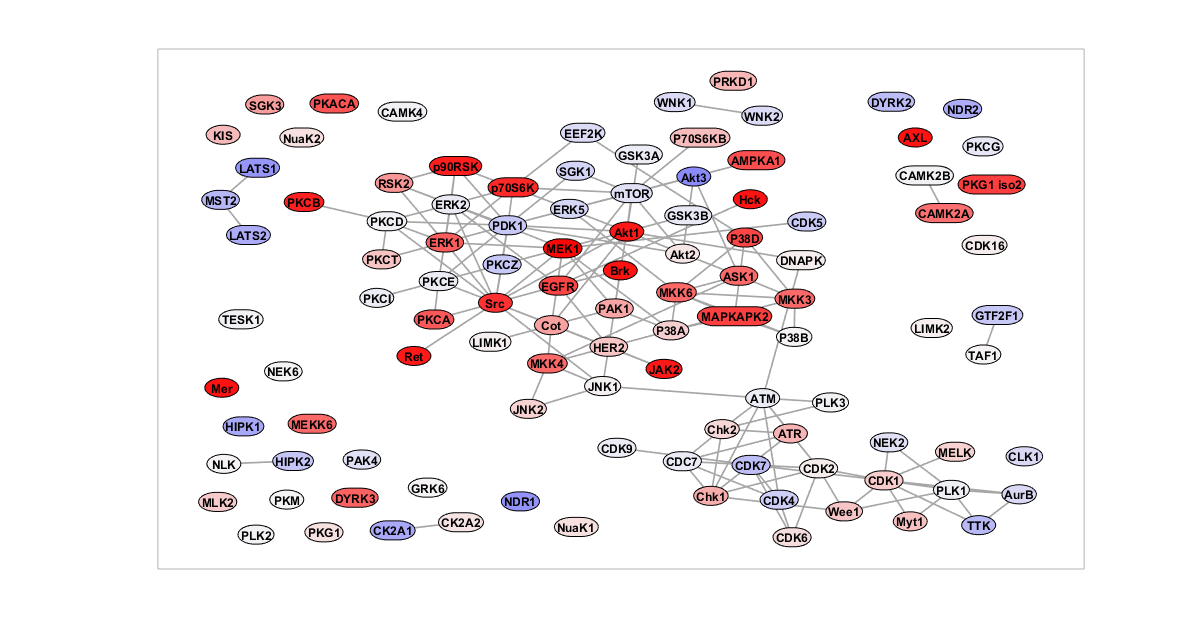
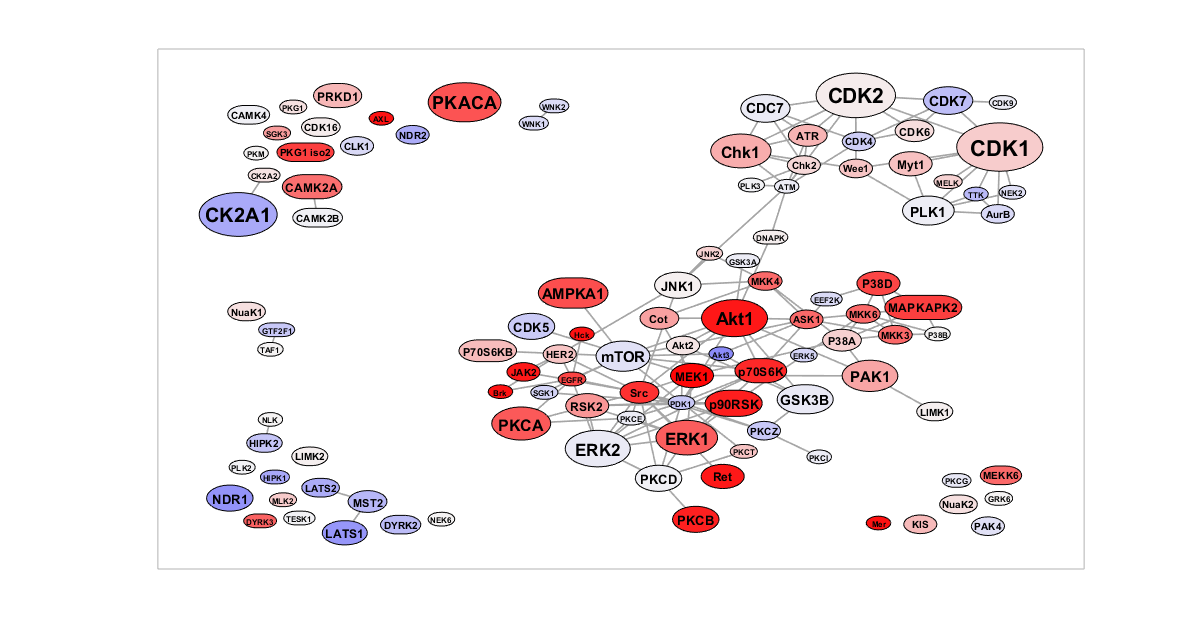
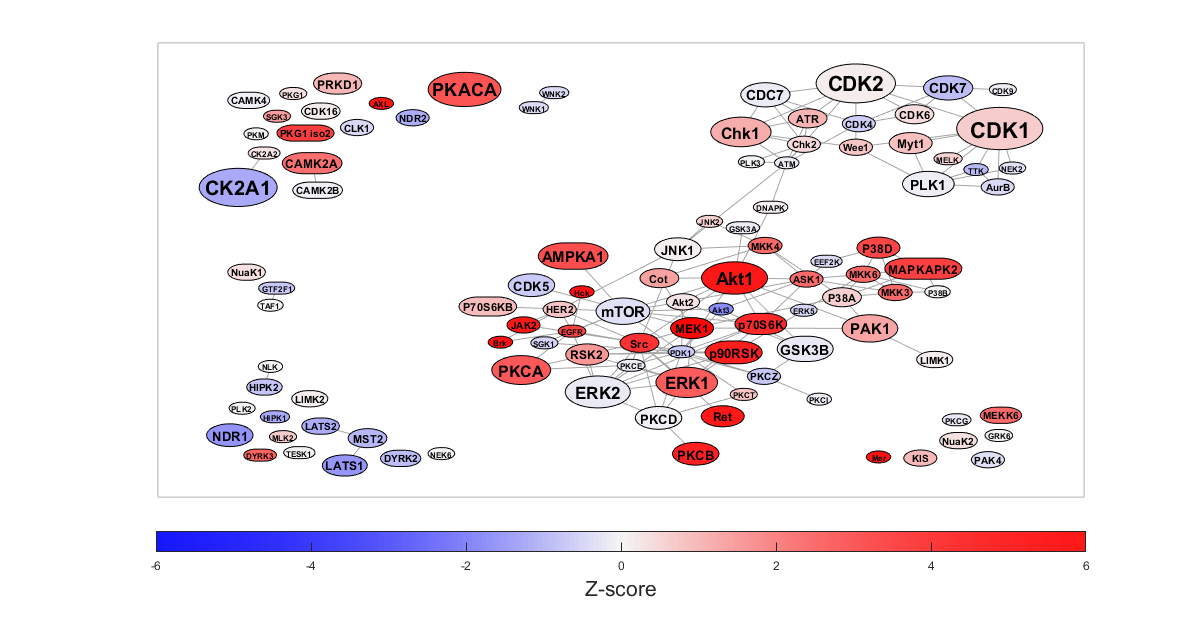
The goal will be to create a network figure between kinases, node colors reflecting the Z-scores and sizes reflecting NumTargets.
load('data/sample_network_kinase_ppi.mat');

disp(NodeList(1:5, :)) % Display the first 5 rows
disp(EdgeList(1:5, :)) % Display the first 5 rows
      Name        ZScore     NumTargets
    _________    ________    __________

    {'SGK1' }    -0.53248         1
    {'CDC7' }    -0.16278         6
    {'EEF2K'}    -0.41983         1
    {'Chk1' }      1.2041        12
    {'P38D' }      3.6201         4

      Node1       Node2
    _________    ________

    {'CDC7' }    {'Chk1'}
    {'EEF2K'}    {'P38D'}
    {'SGK1' }    {'PDK1'}
    {'CDC7' }    {'Chk2'}
    {'Chk1' }    {'Chk2'}
Initial preparation
rng(1, 'twister'); % For reproducibility

% Map the edges and generate the network as a sparse matrix
[~, i1] = ismember(EdgeList.Node1, NodeList.Name);
[~, i2] = ismember(EdgeList.Node2, NodeList.Name);
nNode = height(NodeList);
W = sparse(i1, i2, true, nNode, nNode);
W = W | W'; % Make the matrix symmetric

% Initialize the networkvisualizer for the current network
net = networkvisualizer(W);
Add labels and draw the network
% Add labels to nodes
net.setNodeLabels(NodeList.Name);
net.setNodeSizes('auto');

% Prepare the figure and plot
figure(1);
clf();
set(gcf, 'Position', [0 0 1200 640]);
set(gcf, 'Color', [1 1 1]);
plot(net);
movegui('center');

Apply quantitative coloring based on Z-Scores
% Apply quantitative coloring
sigmoid_scale = 2;
applySigmoid = @(x, k) 2 ./ (1 + exp(-x/k)) - 1;
applyColoring = @(q) color_spacing_continuous(q, [-1 0 1], [0 0 1; 0.96 0.96 0.96; 1 0 0]);
colors = applyColoring(applySigmoid(NodeList.ZScore, sigmoid_scale));
net.setNodeColors(colors);

% Plot the figure again
figure(1); plot(net);

Adjust the node sizes based on number of targets
% Set the node sizes and reapply layout
sizeScaling = 1.5 + log2(NodeList.NumTargets + 0.5);
net.scaleNodeSizes(sizeScaling, 0.8);
net.dolayout();

% Scale the labels based on node size
net.setNodeFontSize(2 + 2 * sizeScaling);

% Enlarge the node sizes by 40% and make sure they contain the labels
net.setNodeSizes(net.NodeSizes*1.4);
net.setNodeSizes('auto');

% Plot the figure again
figure(1); plot(net);

Further tweaking and legend
% Set the edge line width to be less visible/obstructive
net.setEdgeLineWidth(0.75);

% Plot the figure again
figure(1);  plot(net);

% Add a legend to the figure from -6 to 6
zmin = -6; zmax = 6;
color_scale = applySigmoid(linspace(zmin, zmax, 200)', sigmoid_scale);
colormap(applyColoring(color_scale));
clim([zmin, zmax]);
c = colorbar('Location', 'southoutside');
c.Label.String = 'Z-score';
c.Label.FontSize = 16;
